
About the Project
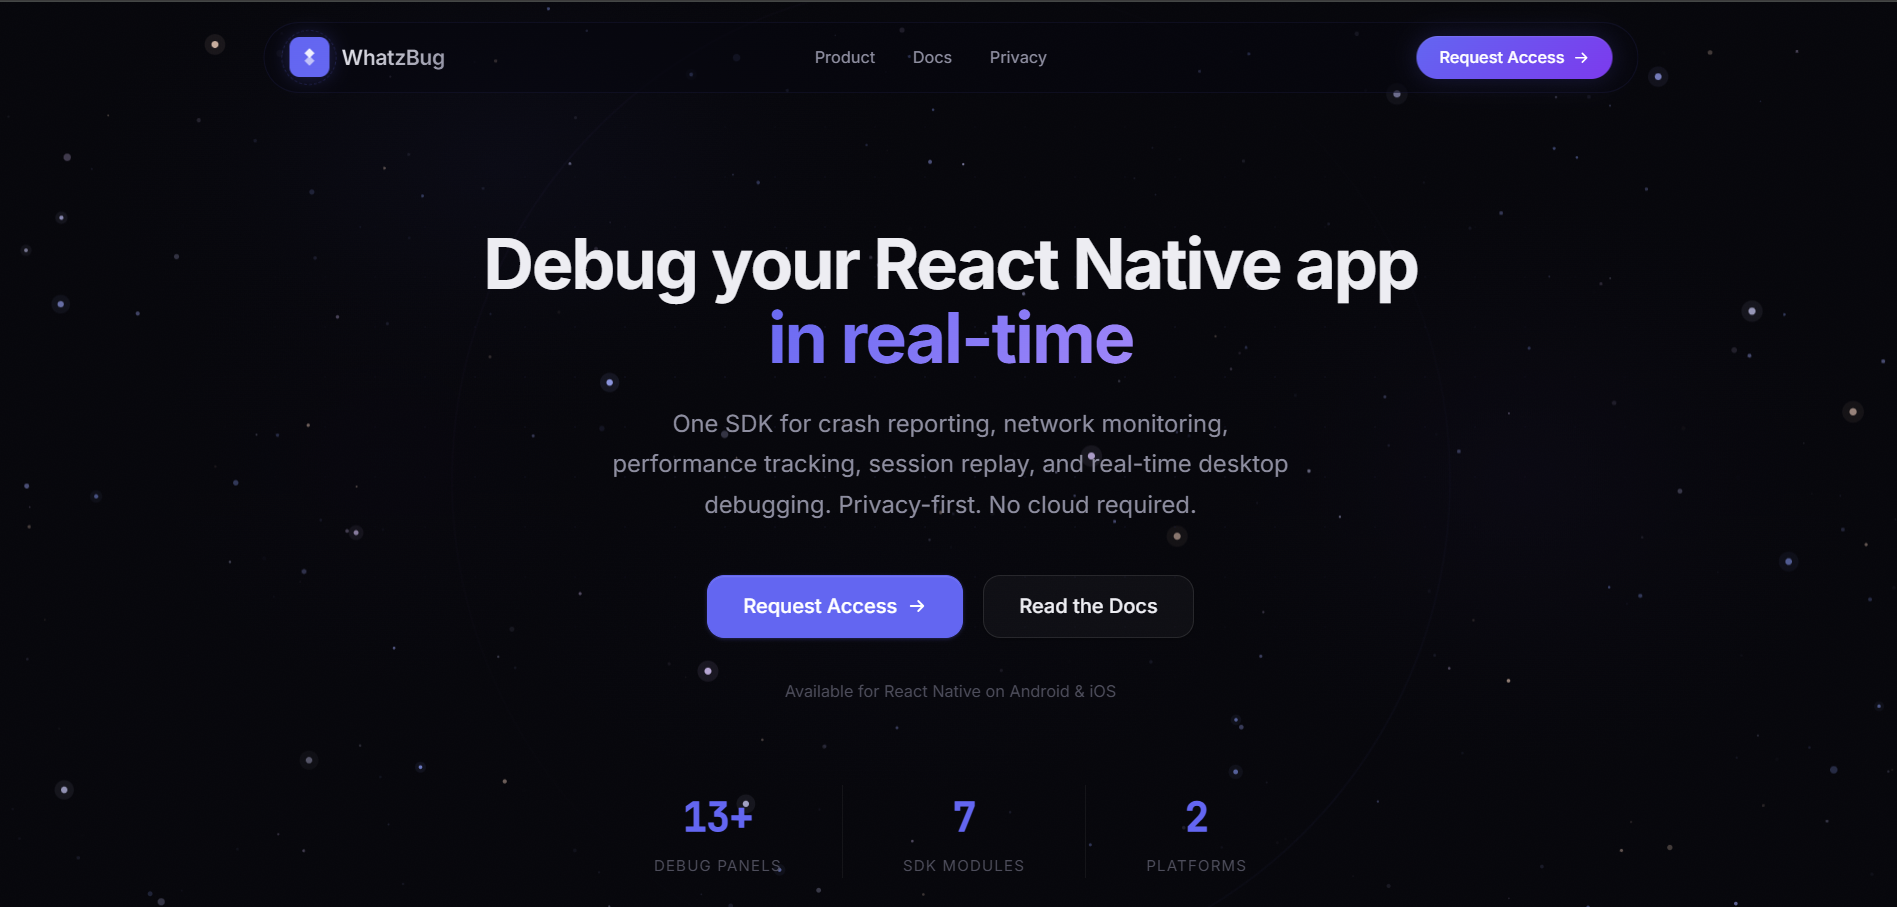
WhatzBug is a production-grade mobile observability platform built specifically for React Native engineering teams. It provides real-time crash reporting with full stack traces, automatic XHR/fetch network interception, screen-by-screen session replay using privacy-masked screenshots, app launch and FPS performance metrics, and a real-time desktop debugger accessible via WebSocket with 13+ inspection panels. The platform prioritizes developer privacy and security through on-device PII redaction before any data is transmitted.
The Challenge
React Native mobile teams lack production-grade observability tools that combine crash reporting, network inspection, session replay, and real-time debugging without compromising user privacy or requiring cloud dependency for local debugging workflows.
The Solution
WhatzBug integrates directly into the React Native app as an SDK, capturing device-level events locally with PII redaction, then exposing them through a WebSocket-connected desktop debugger and a cloud dashboard for async review — giving engineers full visibility without compromising user data.
Our Role & Contribution
WhatzBug represents direct product engineering work — product design, SDK architecture, real-time debugging infrastructure, and developer experience design for mobile engineering teams.
Outcomes
A production-ready React Native observability platform currently in early access, offering engineering teams full-stack mobile visibility without cloud lock-in.
Dashboard & Web Views
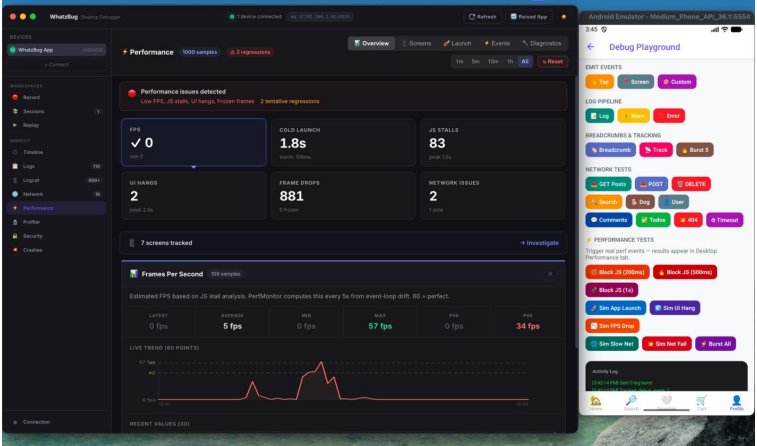
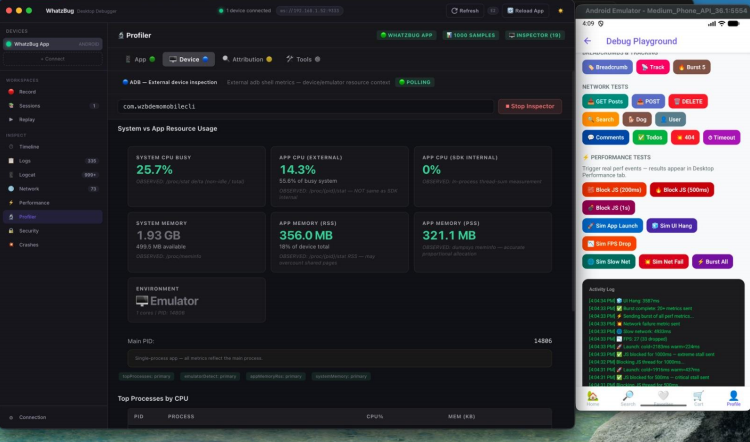
Monitor real-time app resource usage and performance metrics directly from the desktop profiler.
WhatzBug performance diagnostics dashboard showing FPS, JS stalls, frame drops, UI hangs, and network issues.
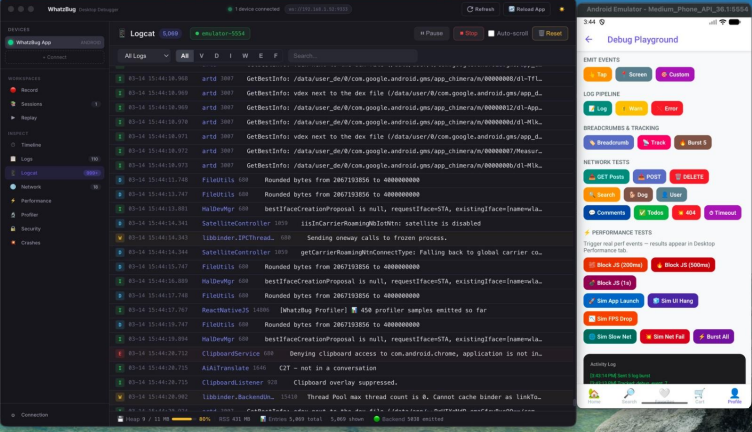
Dark-mode Logcat viewer displaying Android logs, warnings, and debug entries connected to a live emulator session.
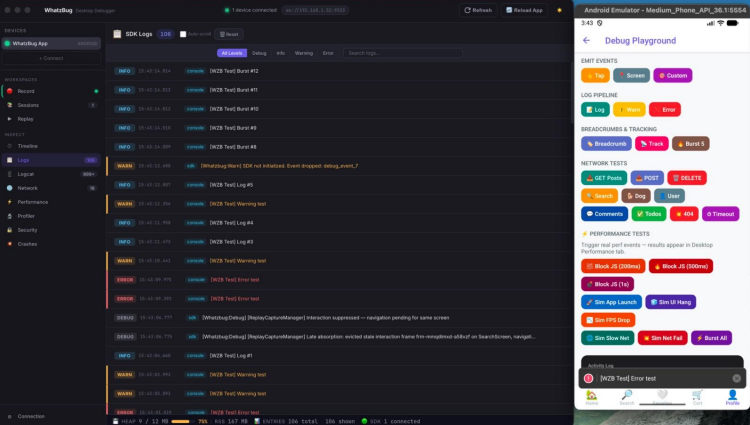
SDK logs dashboard showing info, warnings, debug events, and error messages generated during app testing.
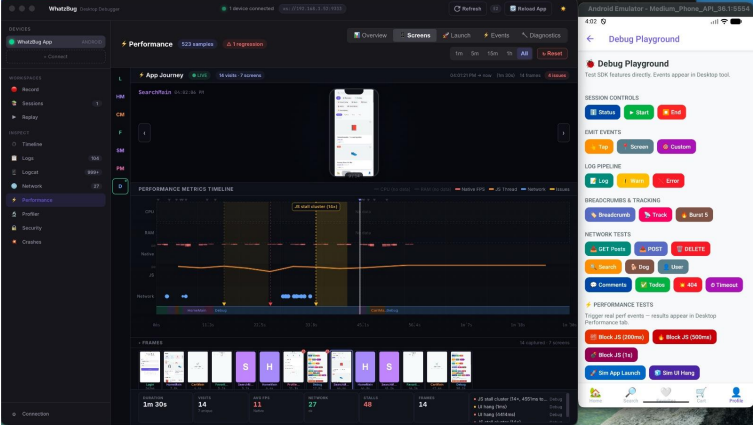
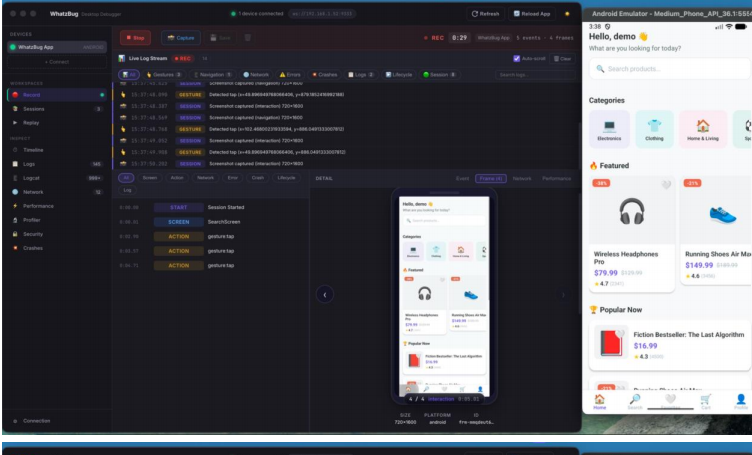
Session management screen displaying recorded app sessions with replay and interaction statistics.
Session replay interface showing live interaction tracking and recorded gestures from a mobile app session.
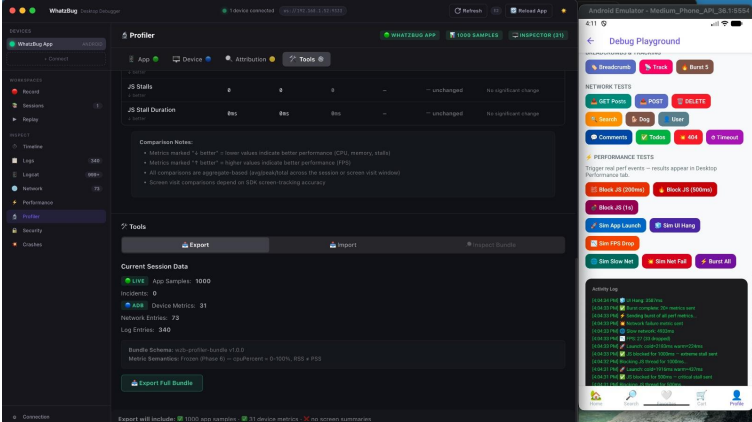
Monitor app performance and resource usage in real time.